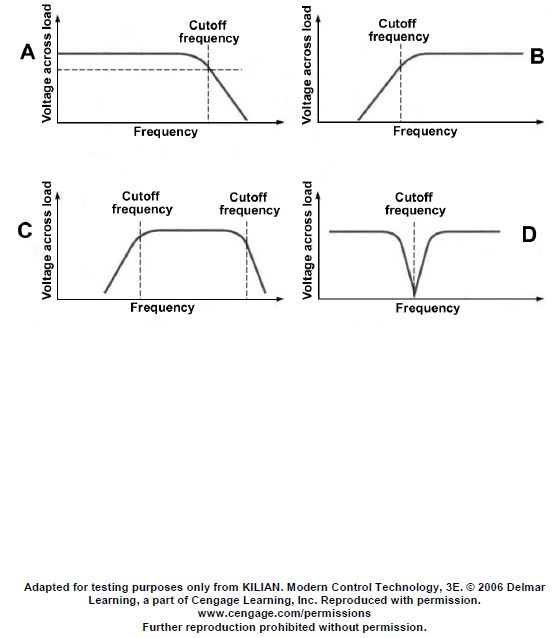
As shown in figure "A" of the illustration, what is true concerning the illustrated frequency response curve? EL-0076
Official USCG Answer & Rule Citation
Correct Answer: Option D — Low frequencies below the cutoff-frequency are attenuated and high frequencies above the cut-off frequency are passed.
The illustrated frequency response curve represents a high-pass filter. Frequencies below the cutoff frequency are attenuated, while frequencies above the cutoff are passed with minimal loss. This circuit is commonly used in signal conditioning to remove low-frequency noise or DC offsets from sensitive instrumentation signals on board.
100% Free & Open Access — No daily limits, paywalls, or gated answers on BrightMariner.