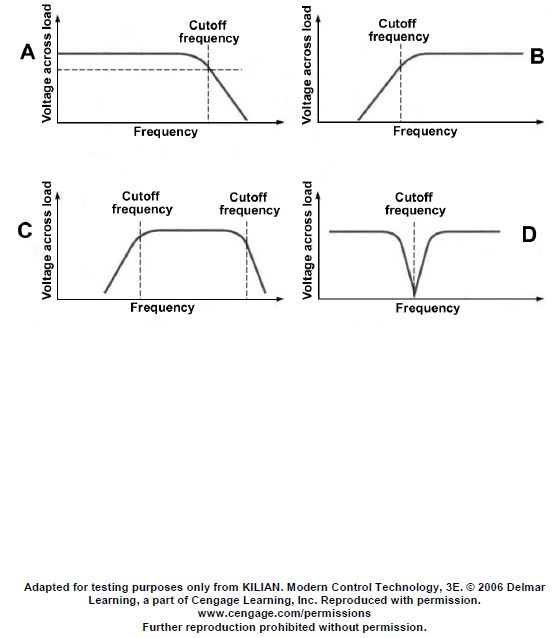
In referring to the graphs shown in the illustration, which of the following figures represents a band pass filter? EL-0076
Official USCG Answer & Rule Citation
Correct Answer: Option C — C
Curve C illustrates a band-pass filter response curve, which permits a specific range of frequencies to pass while attenuating signals above and below that designated frequency band.
100% Free & Open Access — No daily limits, paywalls, or gated answers on BrightMariner.