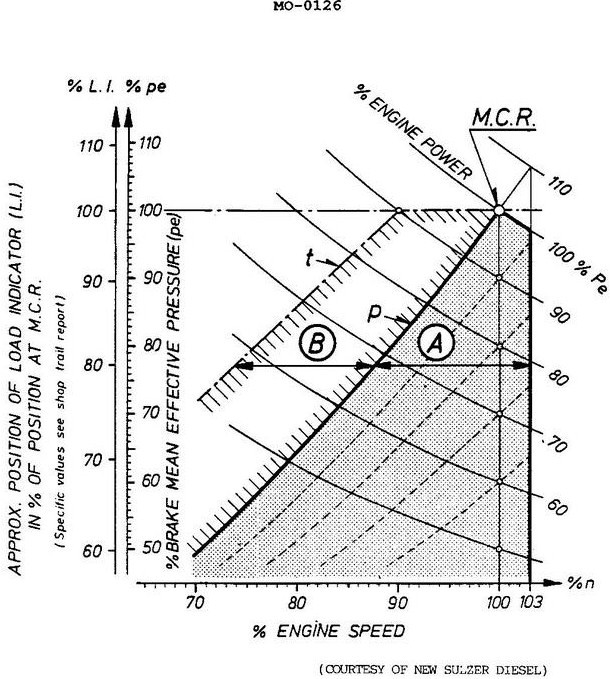
Line "P" in the illustration is the __________. Illustration MO-0126
Official USCG Answer & Rule Citation
Correct Answer: Option B — propeller curve
Line P represents the theoretical propeller demand curve, illustrating the cubic relationship between engine power output and propeller shaft speed under varying operational conditions.
100% Free & Open Access — No daily limits, paywalls, or gated answers on BrightMariner.